Izaña Observatory detects transoceanic transport of emissions from Canadian fires over the North Atlantic subtropical region
1O.E. García 1P.P. Rivas, 1E. Cuevas, and 2S.F. León-Luis
1zaña Atmospheric Research Center (IARC), State Meteorological Agency (AEMET), Spain
2TRAGSATEC, Spain
Contact: ogarciar@aemet.es
The devastating wave of fires that has been raging in Canada since June is of international concern due to the enormous negative impact on air quality. High temperatures, drought and appropriate meteorological conditions are favoring the simultaneous development of several fires as shown in Figure 1, obtained from observations of active Earth Observing System satellites(EOS) [1-3]. The global atmospheric circulation with predominantly easterly winds over this region has favored the long-range transport of particles and gases generated during these fires, allowing them to reach different European countries, including Spain. In addition to containing small particles, the plume is an air mass with a high concentration of carbon dioxide (CO2) and carbon monoxide (CO) produced by the burning of biomass. The Copernicus Atmospheric Monitoring Service (CAMS) has estimated that about 160 megatons of carbon have been emitted to the atmosphere in these fires which represents a new record of emissions since records began 21 years ago for Canada [4].
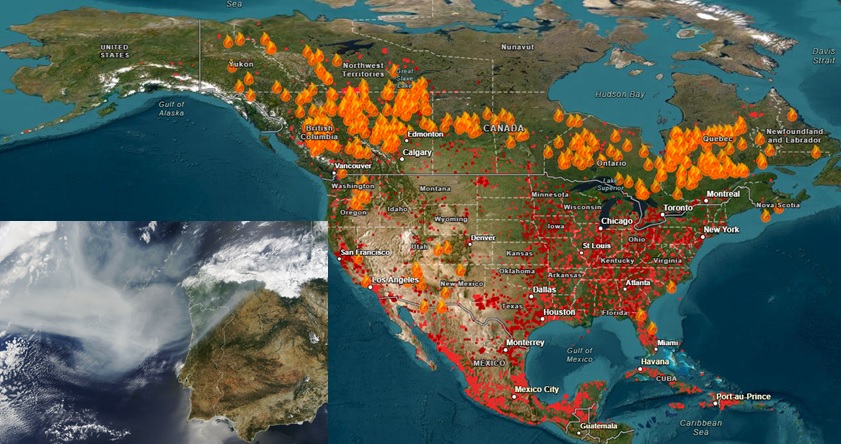
Figure 1.Sistema de información sobre incendios para la gestión de recursos (FIRMS) US/Canada Fire Information for Resource Management System (FIRMS) using Earth Observing System (EOS) satellite observations to assess fire evolution. Image obtained by the Visible Infrared Imaging Radiometer Suite (VIIRS) aboard the joint NASA/NOAA NOAA-20 satellite of the arrival of smoke from the Canadian wildfires in Portugal and Spain on June 27, 2023.
The Izaña Observatory (IZO, Tenerife), dependent on the State Meteorological Agency (AEMET), has identified an episode where CO2 and CO concentrations in situ have experienced significant increases with respect to background conditions. In addition, other column and surface observation techniques have identified the presence of particles with physicochemical characteristics similar to those generated in biomass burning. In particular, on June 29 and 30, 2023, measurements from these instruments identified the presence of an air mass with these characteristics. Figure 1 shows the surface atmospheric concentrations of CO2 and CO acquired in the context of the ICOS-ERIC network, their correlation andm where the calculated FLEXTRA back-trajectory confirms that its origin is Canada. In this event, a slight increase in CO2 concentration is observed with respect to its background value (421 parts per million, ppm). However, this gas presents a daily variability of the same order of magnitude so that, by itself, it cannot be used to identify the characteristics of the air mass. In contrast, the CO concentration reached 400 ppb compared to the background value (90 parts per billion, ppb). This confirms the presence of an air mass with different characteristics and where the good correlation between the increases of both gases points to the same origin.
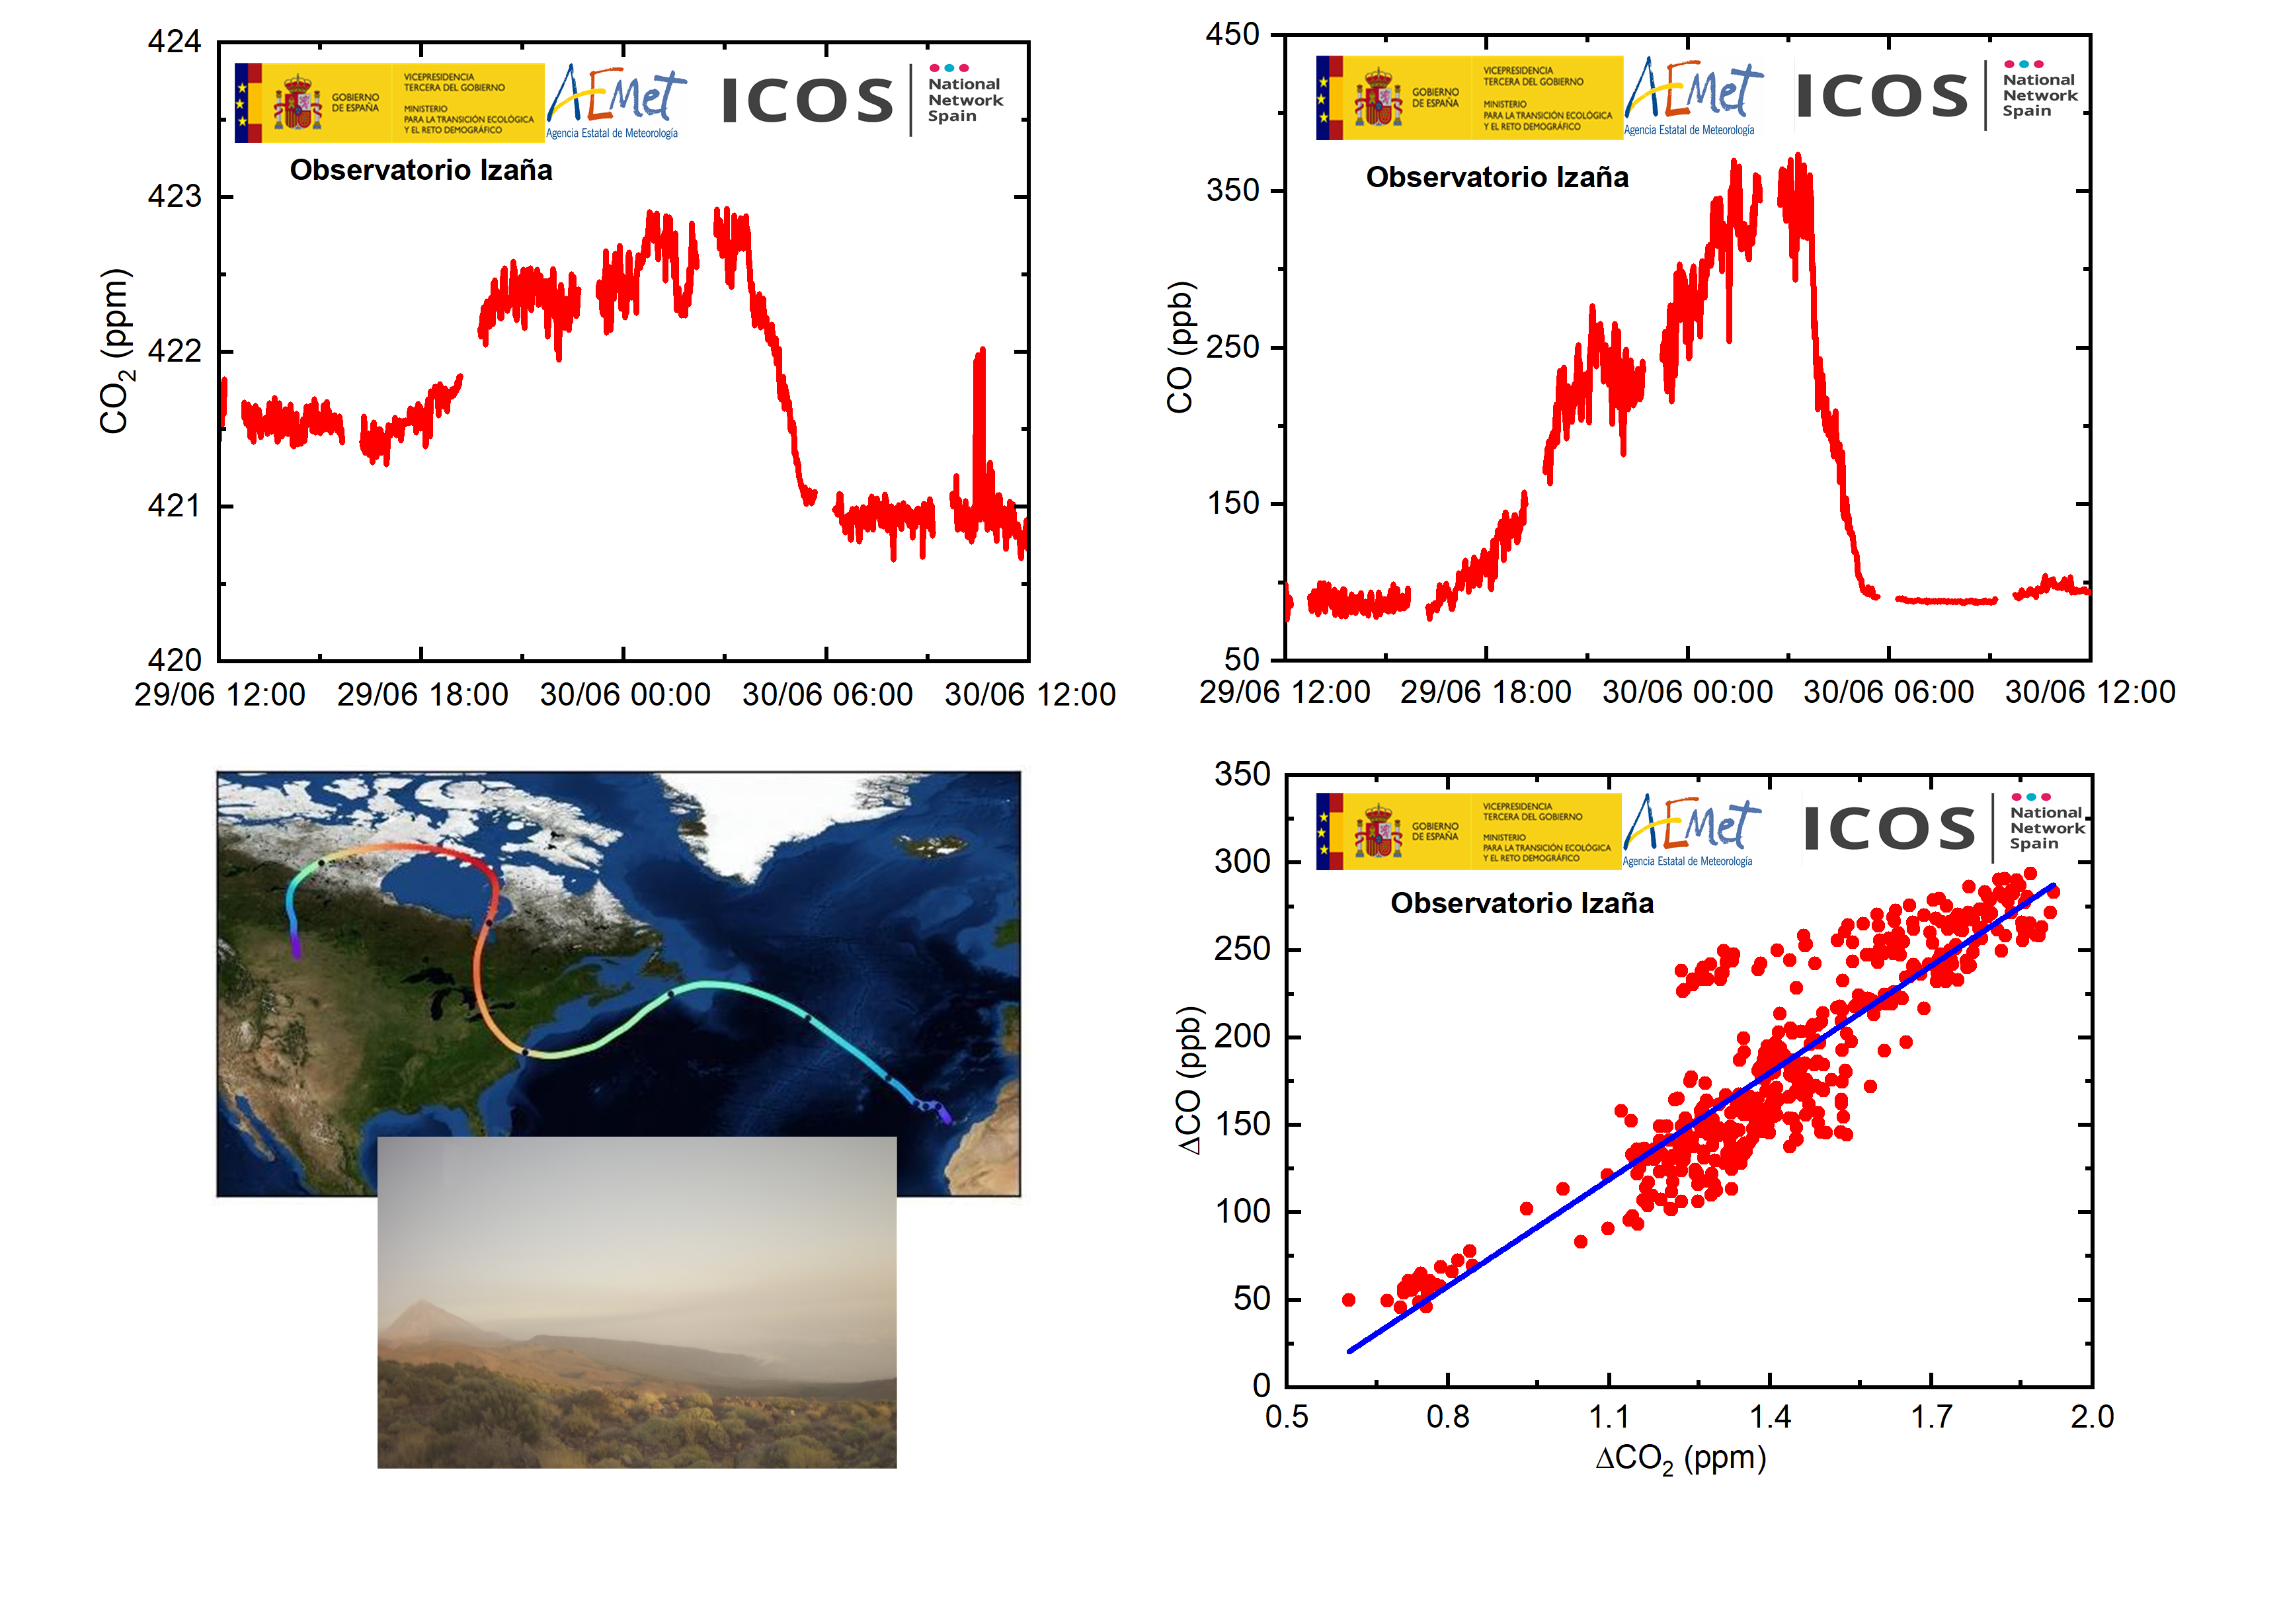
Figure 2. (Top) Atmospheric CO2 and CO concentration recorded at IZO during June 29 and 30, 2023. (Bottom). Calculated back-trajectory of June 29 and photograph taken from IZO and correlation between surface CO2 and CO concentrations. Note: Provisional data subject to revision.
The back-trajectories calculated for the June days indicate that several air masses coming from Canada reached the Canary Islands region, although, at a different altitude than IZO. In addition, these air masses were mixed with others coming from North Africa. Figure 3 shows the time evolution of the depolarization ratio of the backscattered signal from the micropulsed lidars installed at IZO and at the Izaña Atmospheric Research Center (IARC) headquarters in Santa Cruz de Tenerife (SCO). The low altitude of SCO, at 50 m.a.s.l., allows us to know the vertical distribution of particles in the atmosphere during June 29 and 30. Their measurements indicate that there was a layered distribution of mineral dust (yellow) and particles from biomass burning (green) in the atmosphere during this event. However, as recorded, the smoke layer was only at the height of the IZO between noon on June 29 and the early morning of June 30, a period when the surface instruments measured an increase in CO2 and CO concentration compared to background conditions.
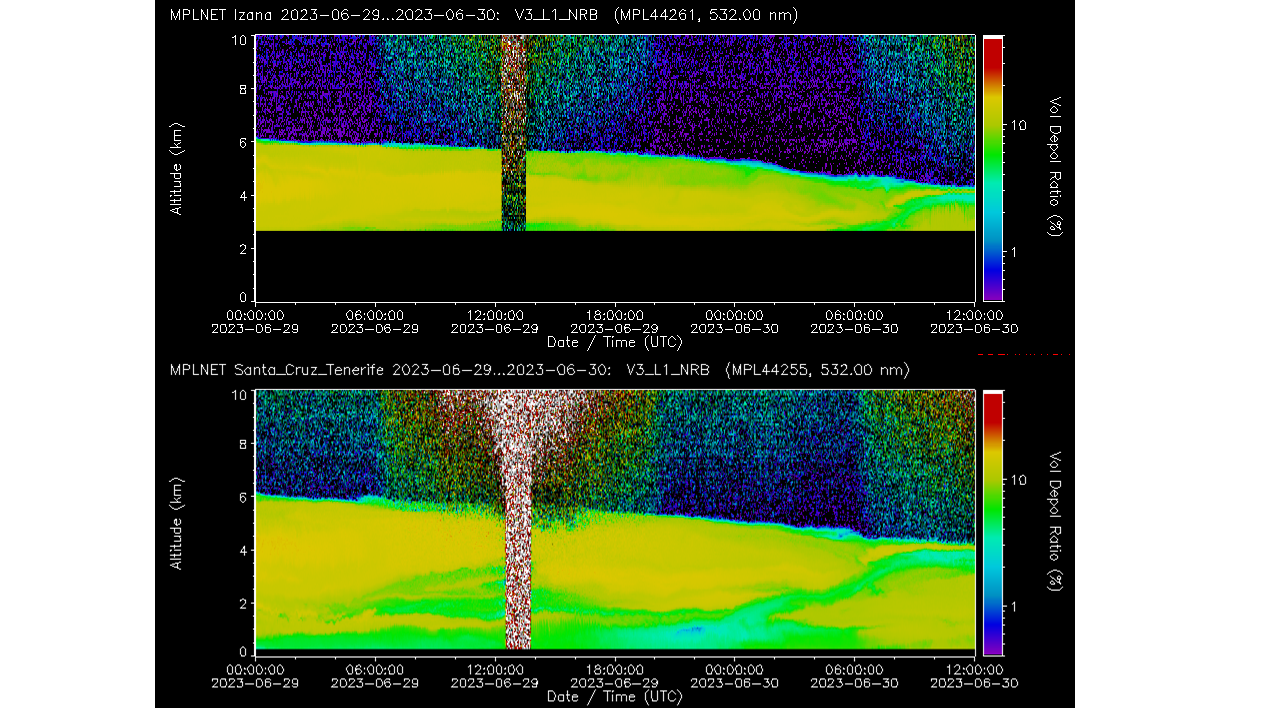
Figure 3. Evolution of the lidar profile at IZO and SCO for June 29 and 30, 2023.
This event, which originates more than 5000km away, highlights the importance of understanding the dynamics of atmospheric circulation in order to study the potential negative impacts on a region due to events originating hundreds of kilometers away. IZO is part of the World Meteorological Organization's Global Atmosphere Watch (WMO-GAW), the Integrated Carbon Observing System (ICOS-ERIC) and the Aerosol, Cloud and Trace Gas Research Infrastructure (ACTRIS).
Referencias:
[2] https://www.nesdis.noaa.gov/news/smoke-canadian-wildfires-blankets-us/
[3] https://gml.noaa.gov/ccgg/trends_ch4/
[4] https://earthobservatory.nasa.gov/images/151507/canadian-smoke-reaches-europe