Izaña observatory yet again recorded a historical maximum in the concentration of carbon dioxide (CO2) in May 2021. Covid-19 has not slowed down the increase of the greenhouse gas in the atmosphere.
Reported by 1E. Cuevas, 1P.P. Rivas and 2S.F. León-Luis
1Izaña Atmospheric Research Centre (AEMET), Spain
2TRAGSATEC, Spain
Contact: ecuevasa@aemet.es
The greenhouse gas measurement program at Izaña Atmospheric Observatory (IZO), which belongs to the State Meteorological Agency (AEMET), carried out with the highest quality controls, indicates that concentrations of carbon dioxide (CO2) continue an upward trend, with no change regarding that registered in 2020, as can be seen in Figure 1.
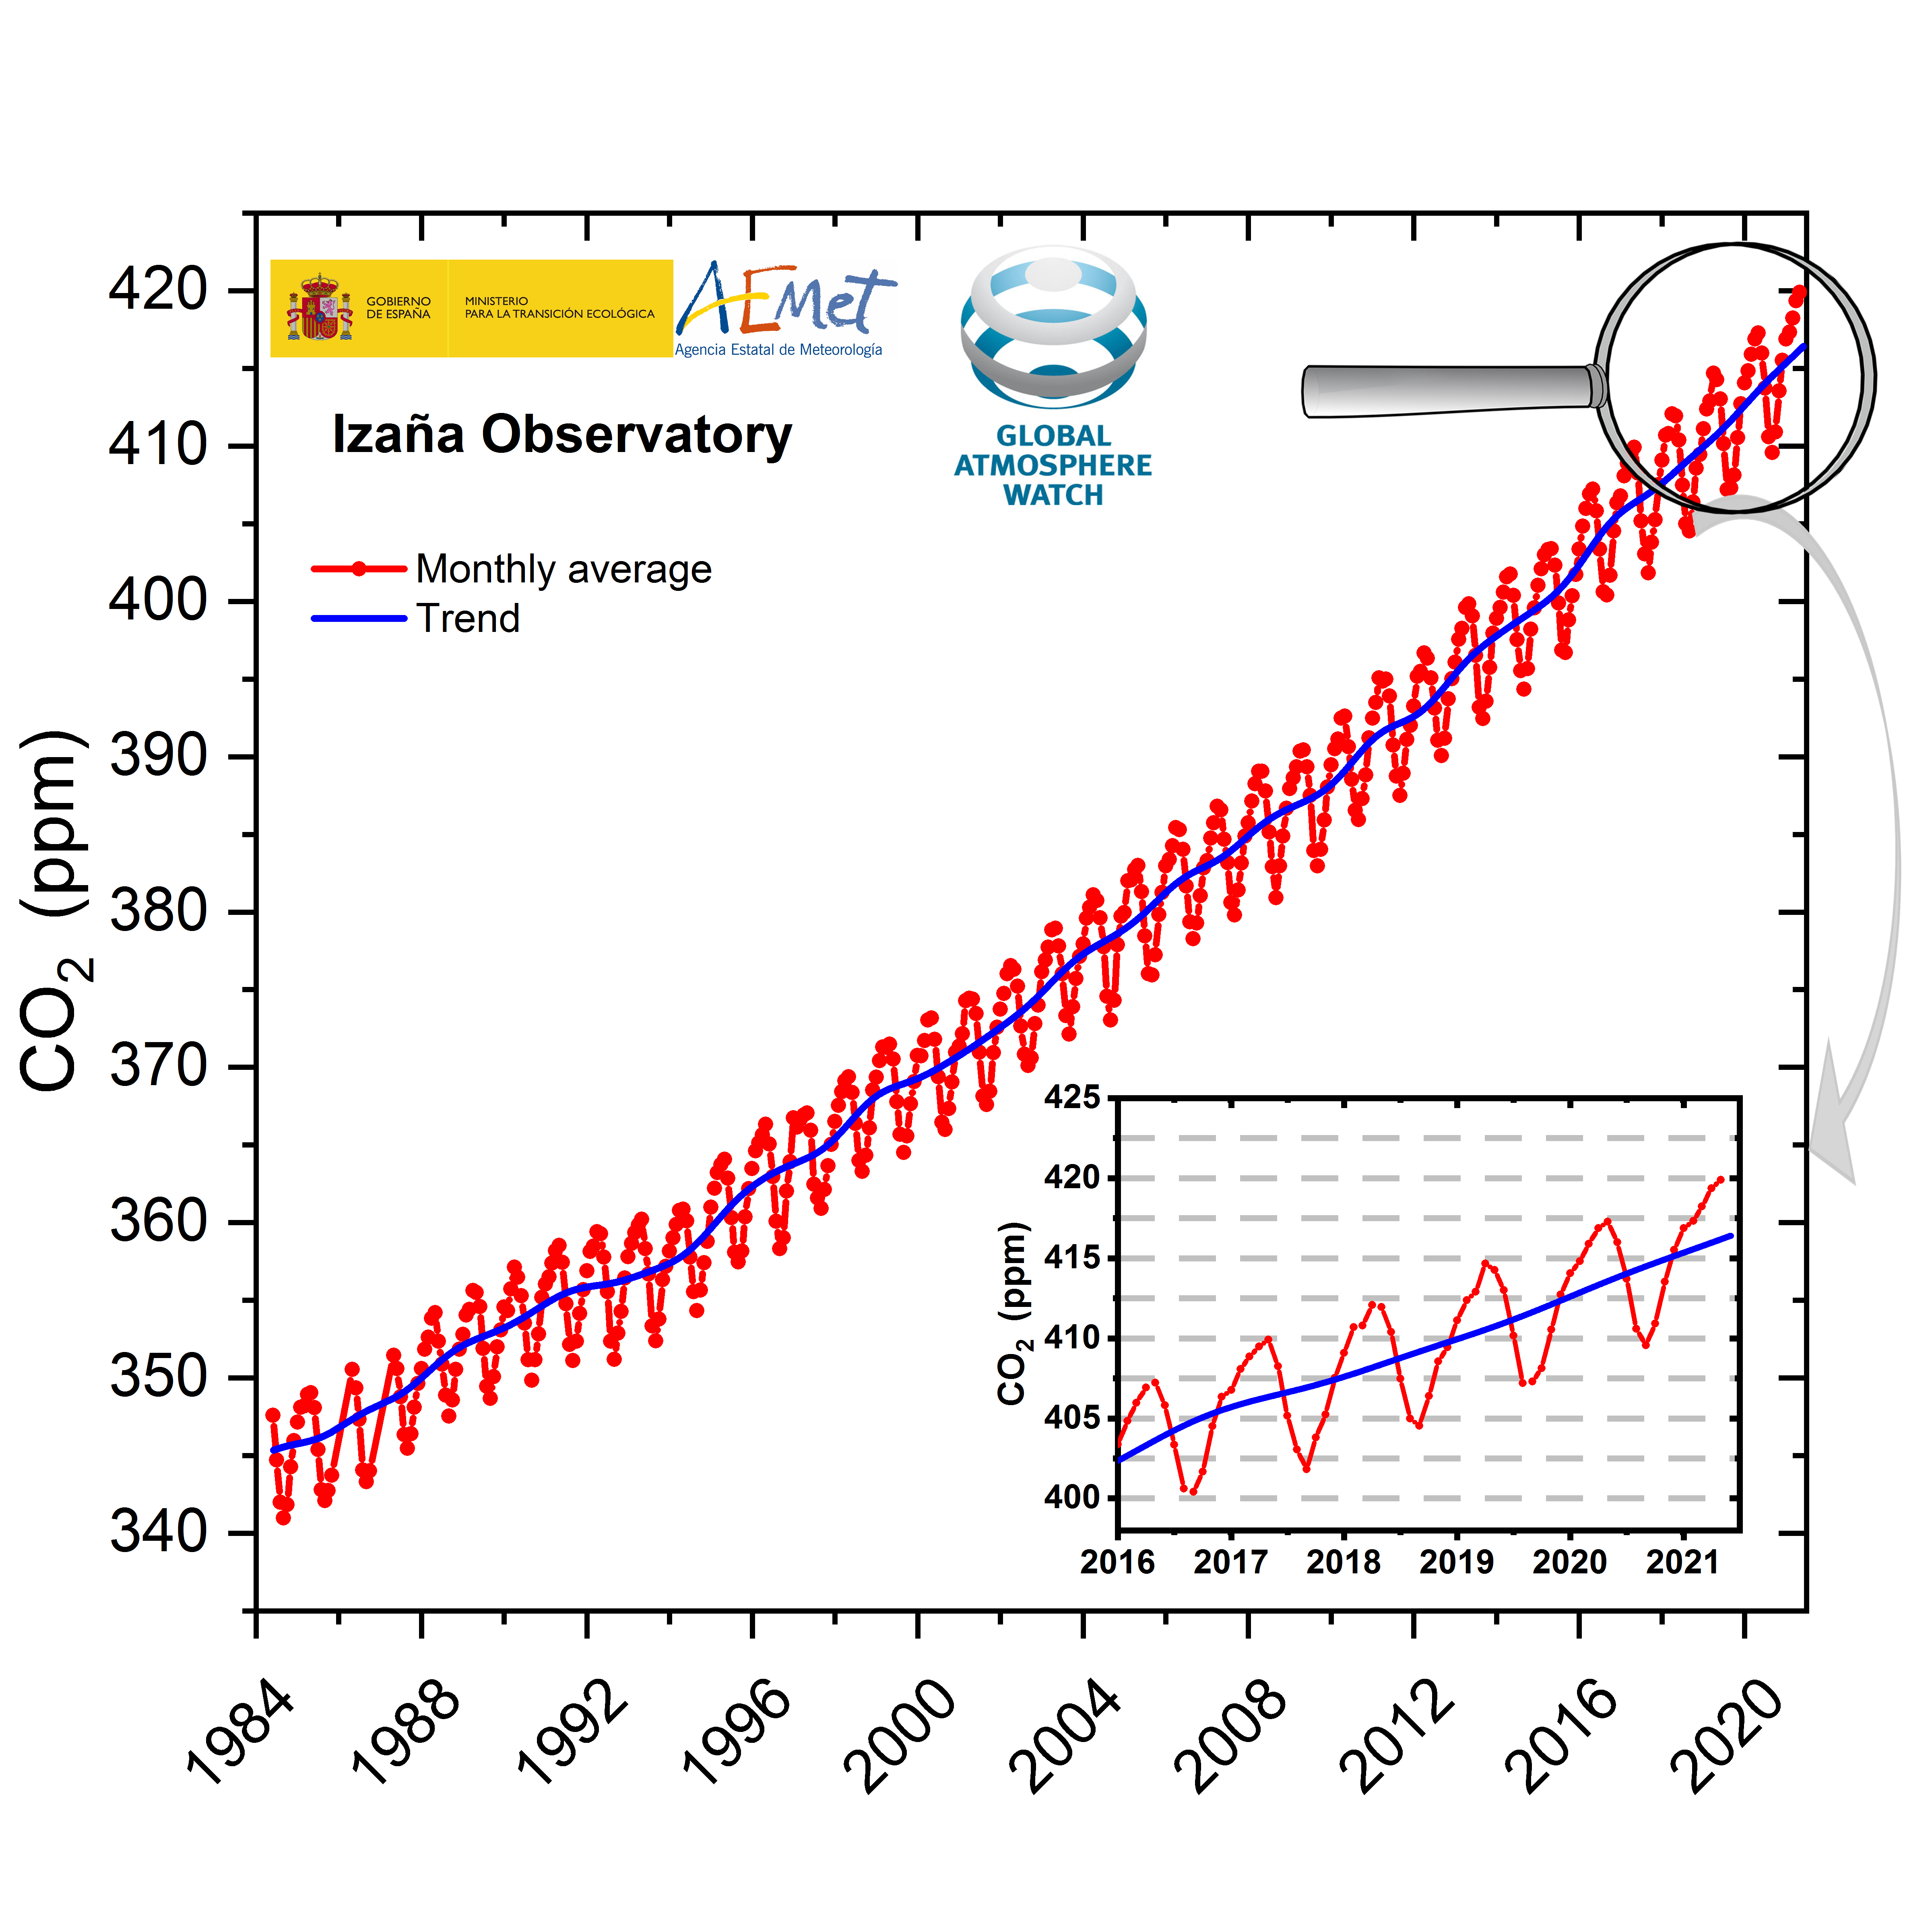
Figure 1. Monthly averages of CO2 concentrations (ppm) calculated from minute measurements taken at Izaña Observatory under atmospheric background conditions (red points) together with CO2 trend (blue line). The enlargement shows monthly averages of CO2 concentrations in the most recent period 2016-2021.+
Figure 1 shows the monthly averages of CO2 concentrations calculated from minute measurements taken at Izaña Observatory under atmospheric background conditions. These averages show both the natural variability associated with the vegetation respiration cycle in the northern hemisphere (sawtooth pattern in red) and the positive trend due to anthropic CO2 emissions (blue line). The annual maximum of CO2 is recorded each year in spring, in late April and early May. In May 2021, Izaña Observatory once again recorded a new historical monthly maximum of CO2 concentration with 419.7 ppm (parts per million), a value similar to the 419.1 ppm recorded by Mauna Loa Observatory (Hawaii, NOAA), the station with the longest CO2 series in the world [1]. These data are still provisional, but the final values will not differ greatly from these.
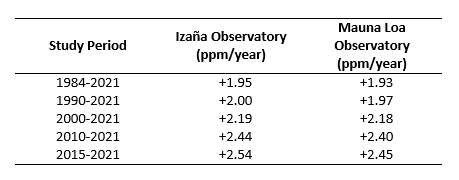
A striking, and concerning, result is that the annual increase in CO2 (ppm/year) between two consecutive annual maximums is not constant, but the year-on-year difference in CO2 increases as the years go by. The following table shows the average annual increase of CO2 considering various periods of years, showing an acceleration when the study period is reduced to the most recent years. This acceleration is also observed when we analyse the monthly averages recorded by Mauna Loa Observatory, which makes sense, as this is a global phenomenon.
In addition, both the daily CO2 values recorded by Izaña Observatory throughout 2021 and the new monthly CO2 maximum of 419.7 ppm for May 2021 show that this acceleration has not been slowed down by the global economic crisis caused by the Coronavirus (Covid-19) pandemic. This crisis produced a decrease in CO2 emissions into the atmosphere due to the partial paralysis of the activity of small and medium-sized companies and the decrease in the transport of goods and passengers worldwide. Recent studies have estimated a reduction of around 7% in CO2 emissions globally due to the reduction in the use of fossil fuels in 2020, in comparison with 2019 [2-4].
The annual averages of CO2 concentrations measured at Izaña Observatory and the estimated annual global CO2 emissions for the 1984-2021 period are shown in Figure 2. The values of annual CO2 emissions were provided by EDGAR (Emissions Database for Global Atmospheric Research) for the period 1984-2019 and by Corinne Le Quéré et al. for 2020 [2-4]. These data show that, prior to the Covid-19 pandemic, there had already been other reductions in annual CO2 emissions, such as that caused by the 2008 global economic crisis, with a percentage decrease similar to that brought about by the Covid-19 pandemic. In general, the years in which economic growth has been affected by an economic crisis, there has been a slowdown in the rate of CO2 emissions into the atmosphere. However, the average annual concentration of CO2 measured in the atmosphere has continued to increase, unaffected by these annual variations.
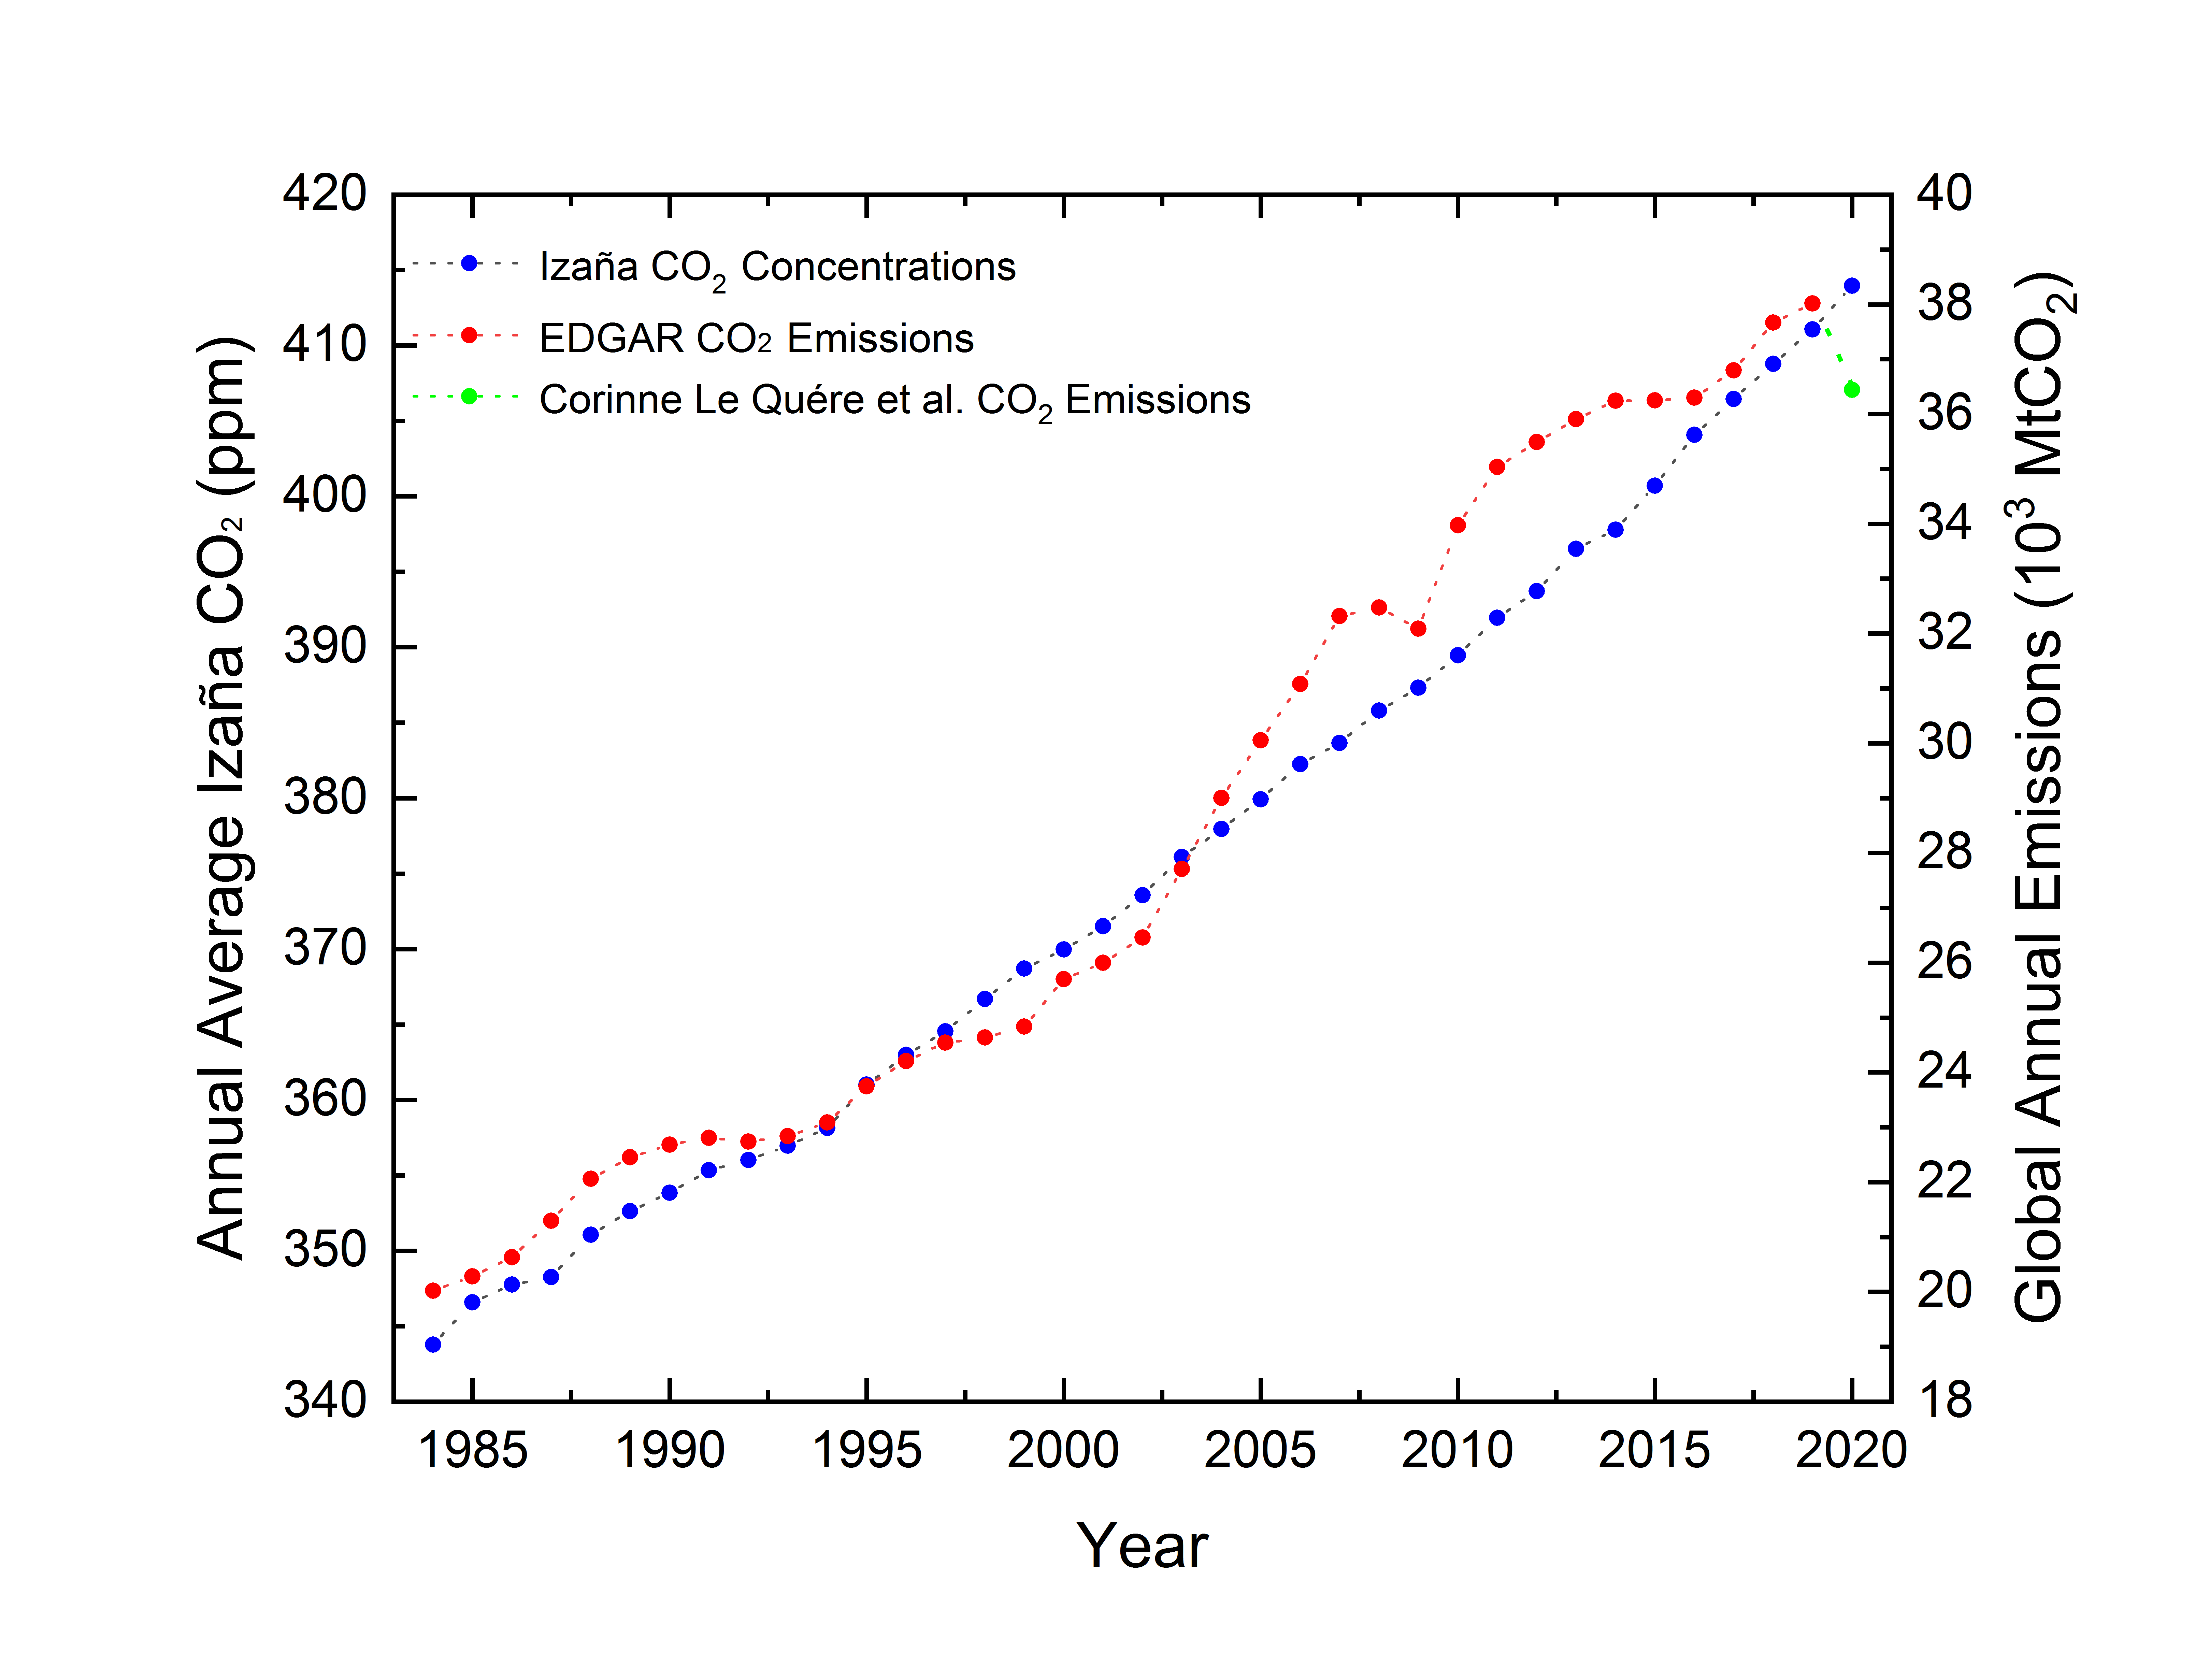
Figure 2. Annual averages of CO2 concentrations measured at Izaña Observatory (blue dots) and estimated annual global CO2 emissions for the period 1984-2021, data provided by EDGAR (Emissions Database for Global Atmospheric Research) (red dots) for the period 1984-2019 and by Corinne Le Quéré et al. for 2020 (green dot) [2-4].
To explain why specific decreases in annual CO2 emissions have not been able to slow down the increasing trend in the concentrations of the gas, we must understand that CO2 concentrations in the atmosphere do not depend on annual emissions, but on the total emissions accumulated in the atmosphere until that moment due to the long life of CO2, whose positive radiative forcing is estimated to last more than 100 years. Figure 3 shows the annual averages of CO2 concentrations measured at Izaña Observatory and the accumulated annual global CO2 emissions associated with the burning of fossil fuels. In this case, the rate of increase in the concentrations of CO2 in the atmosphere and the annual accumulated CO2 emissions at a global level are very similar.
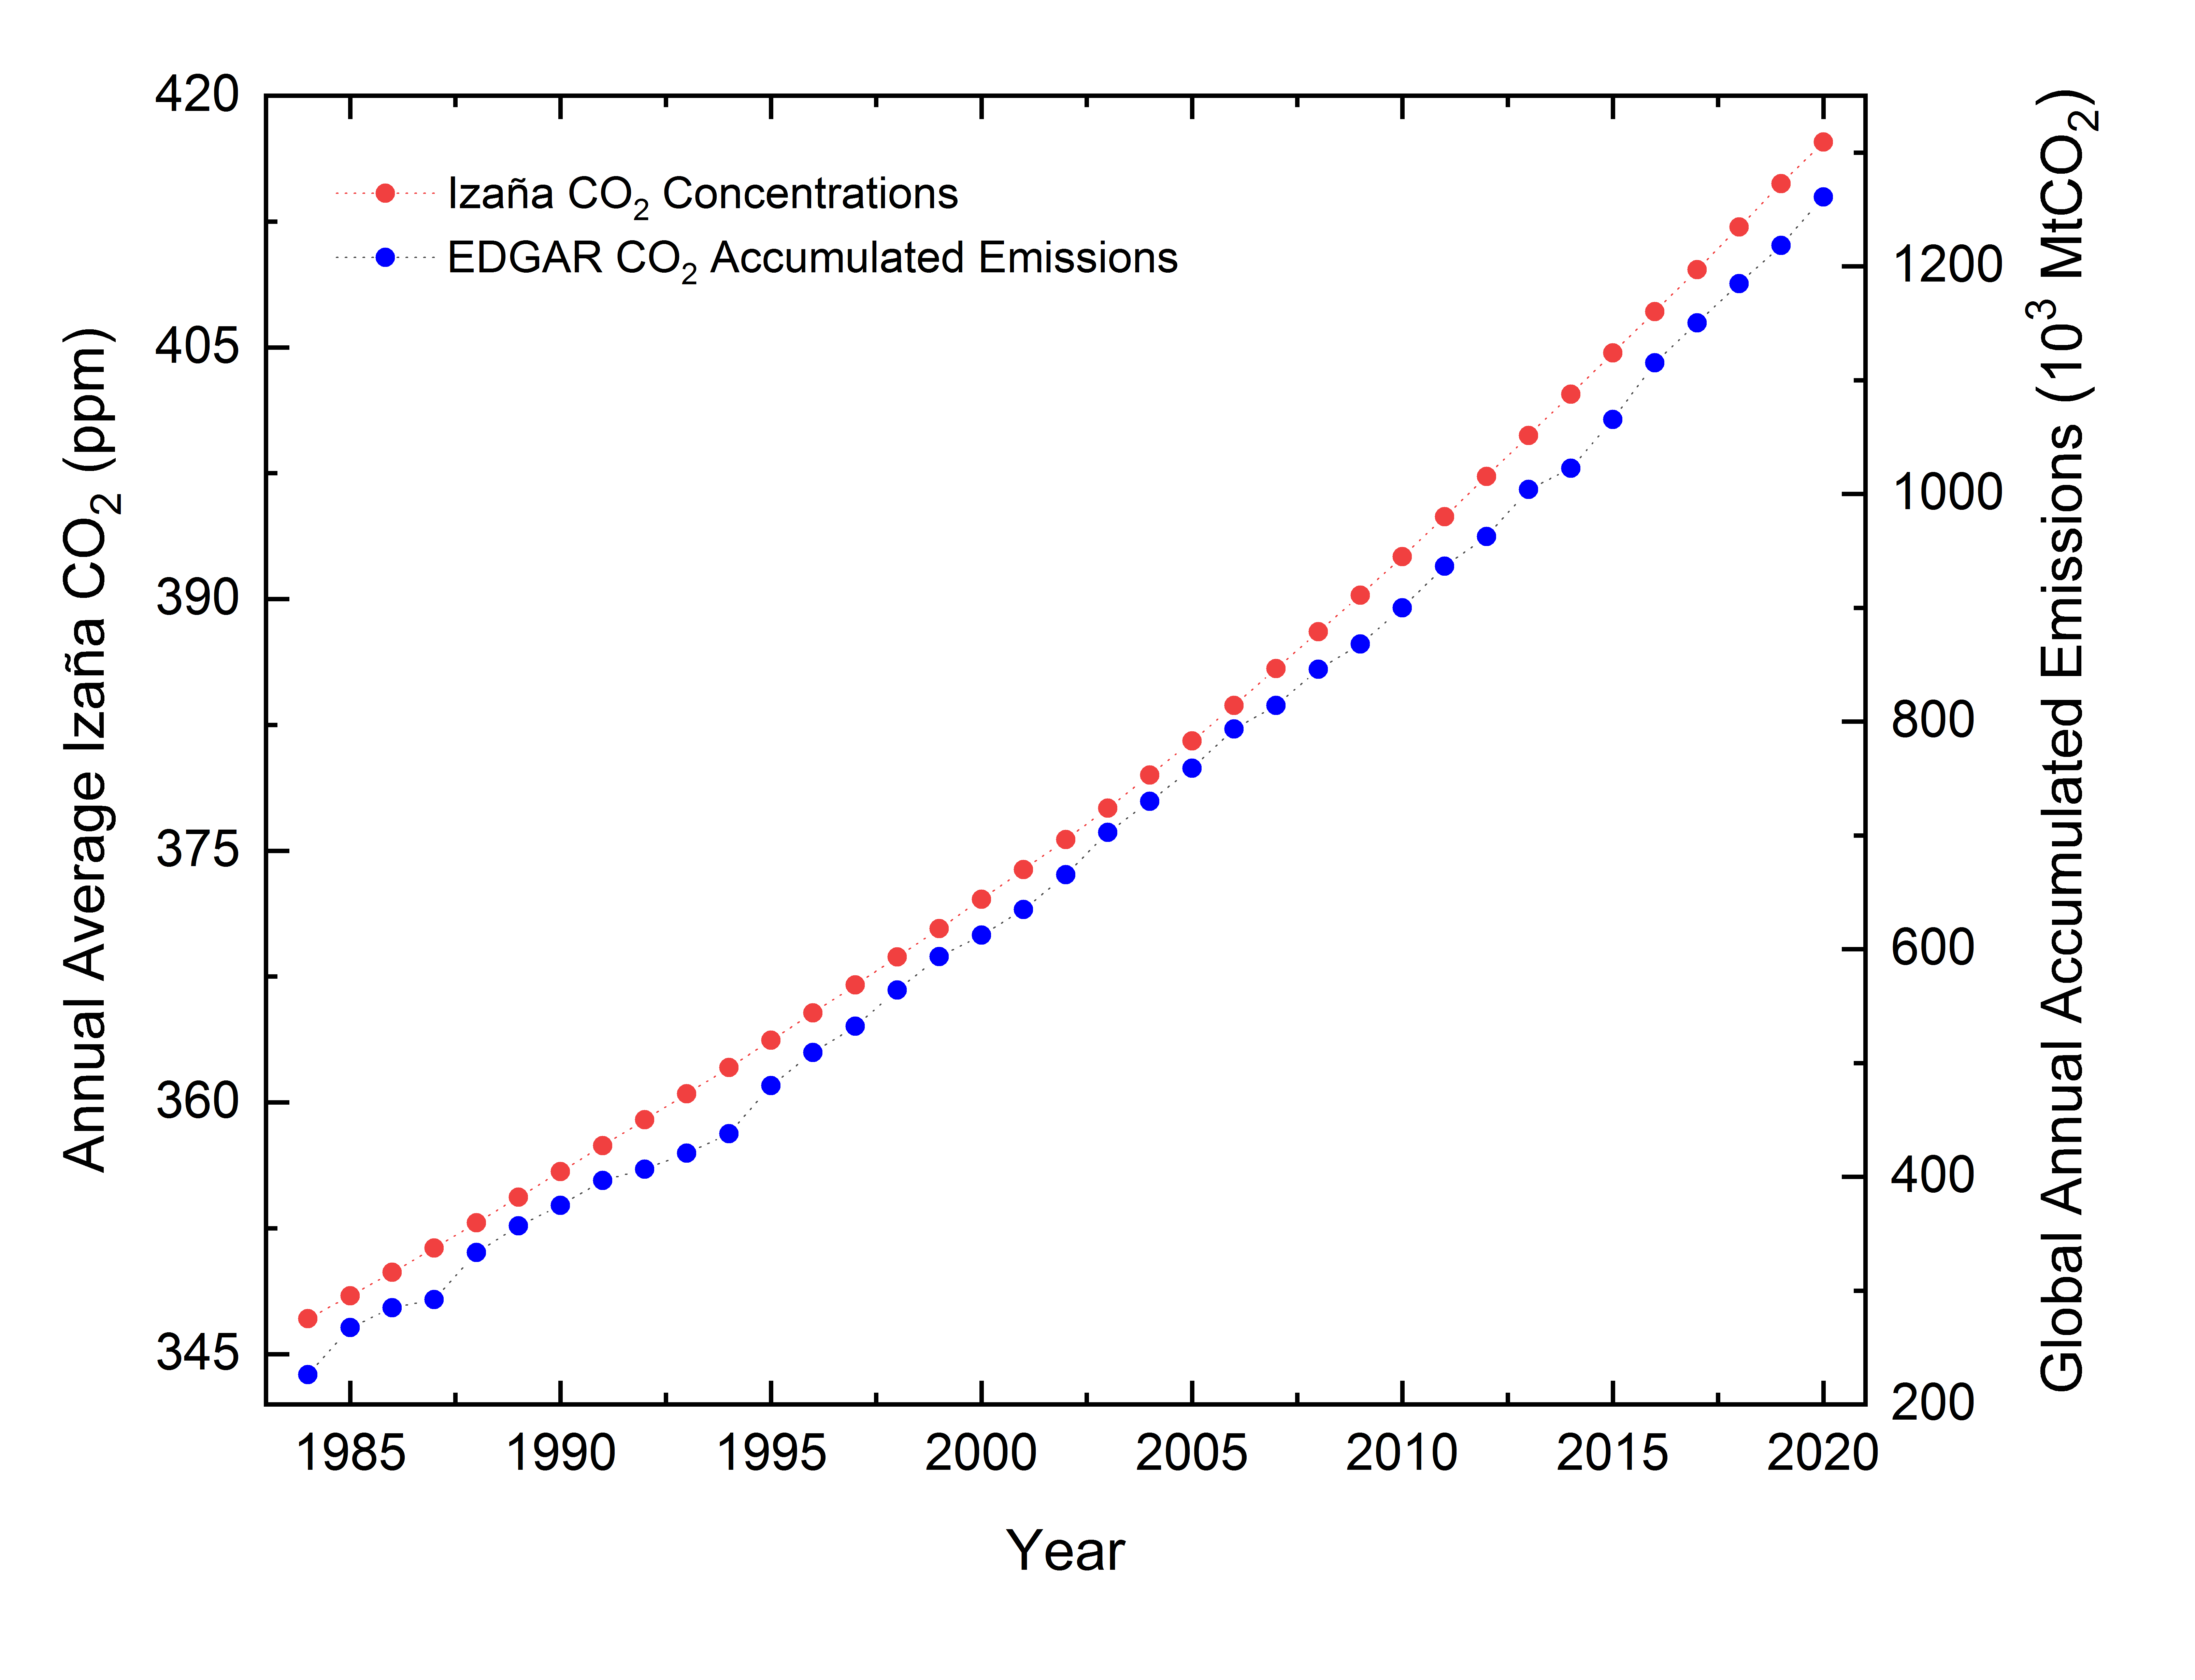
Figure 3. Annual averages of CO2 concentrations measured at Izaña Observatory (red dots) and estimated annual global CO2 emissions in the period 1984-2020 provided by EDGAR (Emissions Database for Global Atmospheric Research) (blue dots).
Therefore, a one-off reduction in annual emissions does not have a direct effect on the annual average atmospheric CO2 concentrations. The long life of CO2 in the atmosphere, and the increasing CO2 emissions recorded throughout the last century and the current century explain that the specific reduction in emissions caused by the Covid-19 pandemic did not generate a decrease in, nor did it stabilise the concentration of CO2 in the atmosphere.
From the above results the following conclusions can be drawn:
- The increase in concentrations of CO2 in the atmosphere has accelerated over recent years
- A one-off decrease in global annual CO2 emissions, such as that caused by Covid-19, is significant only when compared to the previous year, but is irrelevant when analysing accumulated annual emissions of CO2 in the atmosphere at a global level
- Annual averages of CO2 concentrations show a similar trend as that of accumulated annual global CO2 emissions at a global level
Izaña and Mauna Loa observatories are part of the World Meteorological Organization (WMO) Global Atmospheric Watch Programme (GAW). In addition, Izaña Observatory is currently being incorporated into the European ICOS (Integrated Carbon Observation System) infrastructure for the observation and surveillance of greenhouse gases by the European Commission.
References:
[1] https://gml.noaa.gov/ccgg/trends/
[2] Corinne Le Quéré, Robert B. Jackson, Matthew W. Jones, Adam J. P. Smith, Sam Abernethy, Robbie M. Andrew, Anthony J. De-Gol, David R. Willis, Yuli Shan, Josep G. Canadell, Pierre Friedlingstein, Felix Creutzig and Glen P. Peters. Nature Climate Change, Published 18 May 2020. DOI:10.1038/s41558-020-0797-x